Volcano Watch: Using acoustic signals to identify the start of 2022 Mauna Loa eruption
The 2022 eruption of Mauna Loa occurred late in the evening of November 27. The eruption was preceded by intense earthquake activity about half an hour prior to glowing lava seen on USGS Hawaiian Volcano Observatory (HVO) webcams. How does HVO narrow down the precise time that the eruption started?
Remote cameras are critical to confirm eruptive activity but, in many cases, worldwidew, views of the activity can be obscured. Clouds, fog or volcanic gas can block views. Or cameras may not cover the eruption site. Hence, HVO and other global observatories establish numerous methods to attempt to identify eruption activity even if the volcano cannot be clearly seen.
One way to monitor volcanoes is by measuring the sounds of an eruption. These sounds can rapidly travel away from the eruption vent in the same way that a rock thrown into calm water can make ripples that move away from the “plop point.”
The global volcano monitoring community routinely installs clusters of acoustic sensors (called arrays) on the flanks of volcanoes that can measure both the audible noise (sounds we can hear) and the inaudible noise which have frequencies that human ears can’t sense (infrasound). Computer processing is then used to look for signals that come from a distinct direction, similar to the way humans train their ears and brains to determine where sounds come from.
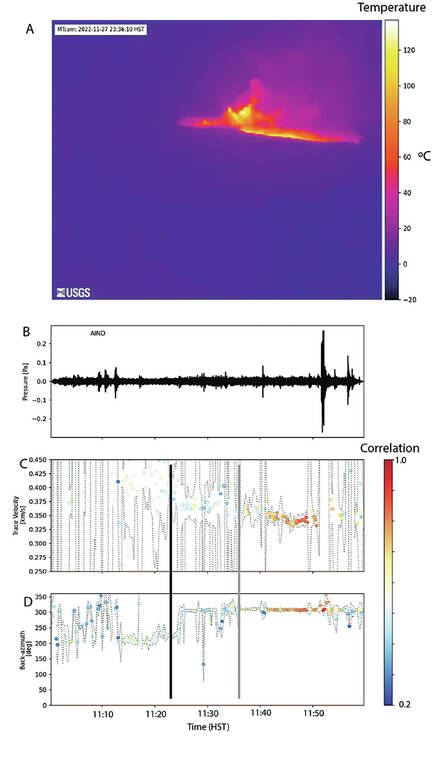
HVO currently monitors our volcanoes using rapidly processed “near real-time” data from acoustic arrays which measure pressure changes around our most active volcanoes, Kilauea and Mauna Loa (figure panel B). The grouped sensor arrays are deployed in the field to allow computers to look for correlations in acoustic energy from Hawaii’s likely eruption centers.
The processing compares all waveforms of the array and looks at consistency (called coherency) of the waves under a range of conditions. In the plots (figure panels C and D) strong waveform coherency are marked by red and orange dots and incoherent waves are marked by light and dark blue. As an analogy, incoherent sounds are like the sounds you hear in the middle of a forest on a windy day and more coherent sound would be from a car honking on the road.
Coherent acoustic signals often have characteristics that allow them to be distinguished by the processing of array data, and two good indicators of coherency come from the wave speed and wave direction across the array. For example, near the surface of the Earth the sounds usually travel at speeds of about 0.3-0.4 km/s (~300-400 yards per second) (figure panel C). HVO’s ‘Ainapo infrasound array is located in the Hawaii Volcanoes National Park and has a compass direction of about 300 degrees (figure panel D) pointing back to Mauna Loa summit. Automated detection can use these characteristics (coherency, wave speed and direction) to improve our ability to rapidly understand when an eruption is occurring at Mauna Loa summit.
Panel D of the figure shows that the compass back direction becomes very stable at about 11:25 p.m. HST which indicates that mild eruptive activity had started. Its timing was probably approximately two minutes earlier, at about 11:23 p.m. HST, given that it takes about 2 minutes for sound to travel from the summit of Mauna Loa to the ‘Ainapo array (shown as a black vertical line in figure panels C and D.) Indeed, panel A of the figure shows that by 11:36 p.m. HST, lava flows being generated by the new eruption were rapidly expanding across Moku‘aweoweo, Mauna Loa summit caldera (grey vertical line in C and D). The progression and expansion of the lava is followed by a strong intensification of that activity around 11:40 p.m. HST (C and D). This shows the value of using multiple lines of information to evaluate eruptive activity.
In addition to acoustic methods, staff at HVO utilize a full range of volcano monitoring methods including seismic, deformation, gas, and webcam imagery. The data collected improve our situational awareness; evaluating the different datasets together can help scientists to understand the volcanic processes happening at any one time. This, in turn, helps HVO to keep the public well-informed about our active volcanoes.
Volcano Activity Updates
Kilauea is not erupting. Its USGS Volcano Alert level is ADVISORY.
Disbursed seismicity continues below Kilauea’s summit and along the Koa‘e fault system southwest of the caldera. Average earthquake counts in this region over the past week have remained below 40 detected events per day, well below the amount detected during the January–February intrusion or prior to recent summit eruptions. Tiltmeters near Sand Hill and Uekahuna bluff continued to record modest inflationary trends over the past week. No unusual activity has been noted along the rift zones.
Mauna Loa is not erupting. Its USGS Volcano Alert Level is at NORMAL.
Webcams show no signs of activity on Mauna Loa. Summit seismicity has remained at low levels over the past month. Ground deformation indicates continuing slow inflation as magma replenishes the reservoir system following the 2022 eruption. SO2 emission rates are at background levels.
Two earthquakes were reported felt in the Hawaiian Islands during the past week: a M3.1 earthquake 10 km (6 mi) ENE of Pahala at 33 km (20 mi) depth on March 23 at 9:06 p.m. HST and a M3.1 earthquake 2 km (1 mi) SSW of Pahala at 32 km (20 mi) depth on March 22 at 9:45 p.m. HST.
HVO continues to closely monitor Kilauea and Mauna Loa.
Please visit HVO’s website for past Volcano Watch articles, Kilauea and Mauna Loa updates, volcano photos, maps, recent earthquake information, and more. Email questions to askHVO@usgs.gov.
Volcano Watch is a weekly article and activity update written by U.S. Geological Survey Hawaiian Volcano Observatory scientists and affiliates.


